|
|
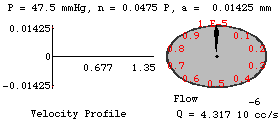
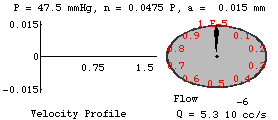
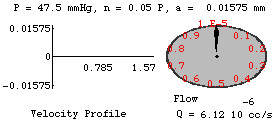
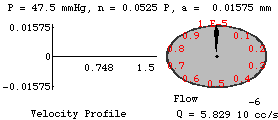
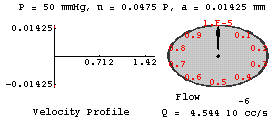
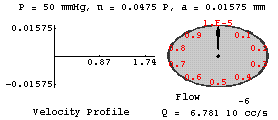
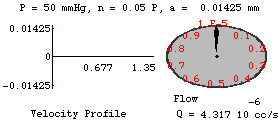
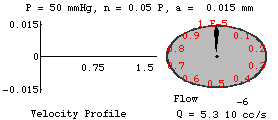
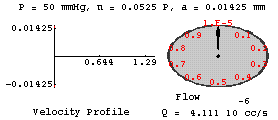
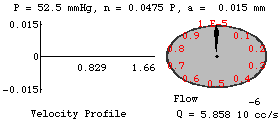
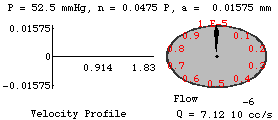
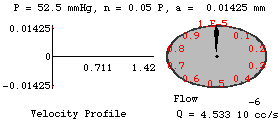
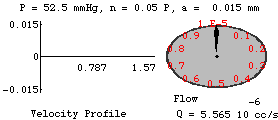
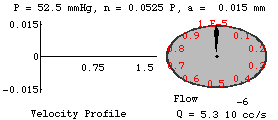
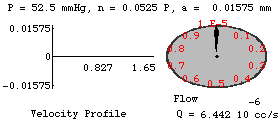
Poiseuille's Law: A Visualization of FlowWe now consider combinations of the parameters changing. As in all of the earlier visual explorations of the flow, each graph will have a black portion referring to the current values, while the red portion refers to the standard values. The table below corresponds to 5 percent changes in the pressure (P), viscosity (V) and radius (R) (+ or -). Recall that the standard values are P=50 mmHg, n=0.05 P, and r=0.015 mm. Challenge! See if you can guess which of the situations will occur:
Click on the links to see the graphics:
|