|
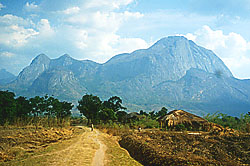
Visualizing DataOffice of Arid Lands StudiesIn 1998, UA researchers published a report on how they used remote sensing and other techniques to create mathematical models to assist decision making within Malawi's land policy reform programme. Malawi is a country in southern Africa.
Mulanje Forest Reserve in Malawi Below is a digital elevation map (DEM) of the Mulanje Forest Reserve. In a DEM, the value of each pixel represents an elevation, in this case, meters above sea level.
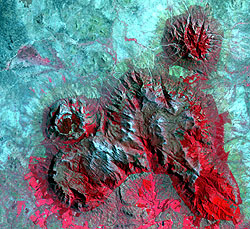
Digital Elevation Map of Mulanje Satellite images give us yet another view of Mulanje. Below is a land cover map LandsatTM image taken in 1994. In this false-color composite, red = infrared channel, green = red channel, and blue = green channel.
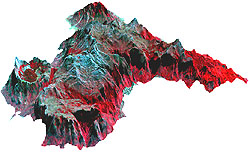
False Color Composite of Satellite Image Sometimes it helps to visualize data in another way. For example, the data from a DEM can be plotted, so that the highest pixel values show up as "peaks" and the lowest ones "valleys." Because the pixel values represent elevation, the resulting image looks like the three-dimensional terrain. In this image, the satellite image is draped over the 3-D perspective.
Surface Plot of Mulanje Other types of data can be represented with pixels. Using satellite imaging, scientists can determine what covers the land.
Land Cover in Mulanje(1994) Pixels can even represent data that was never in the form of a picture. In the image below, different pixel values represent average precipitation (rainfall) in Mulanje. This data was gathered with rain gauges stationed around the reserve. In the picture below, note that although the pixels in this image are arranged in the same shape as the image above, this time the pixels represent precipitation rather than land cover.
Average Annual Precipitation in Mulanje Lastly, pixel values can be calculated from existing data sets. In the image below, the slope (change in elevation) was calculated from the original DEM at the top of this page.
Percent Slope in Mulanje |